Charts
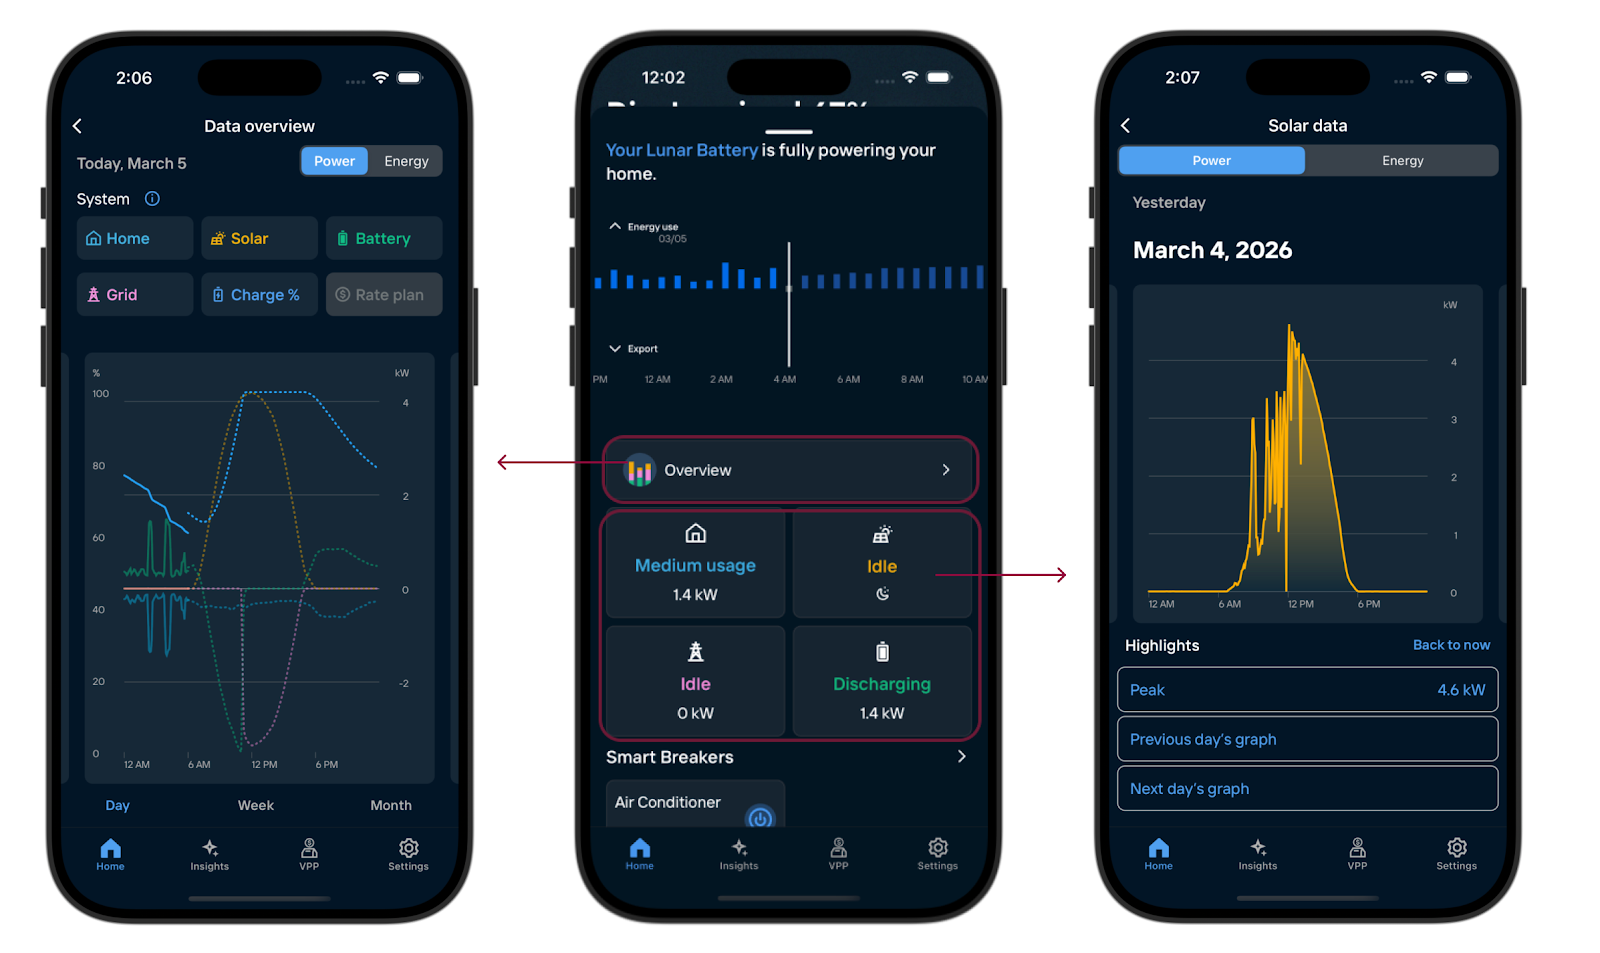
Access your data by pulling up the bottom tab on the Home screen. Tap ‘Overview’ for a system-wide view, or tap any component tile to go to the individual chart.
- Switching Views: Use the toggle at the top, or the top right on Overview, to switch between Power and Energy.
- Move between time periods: Swipe across the chart area to move between time periods.
Overview chart
The Overview chart provides a unified look at your home’s energy ecosystem. It’s designed to show how your solar, battery, and grid work together.
Customizing the view
Tap the component tiles above the chart to show or hide specific trends. This is helpful if you want to isolate, for example, just your solar production against your home usage.
Switch your view between Day, Week, or Month by tapping the timeframe buttons located directly below the chart.
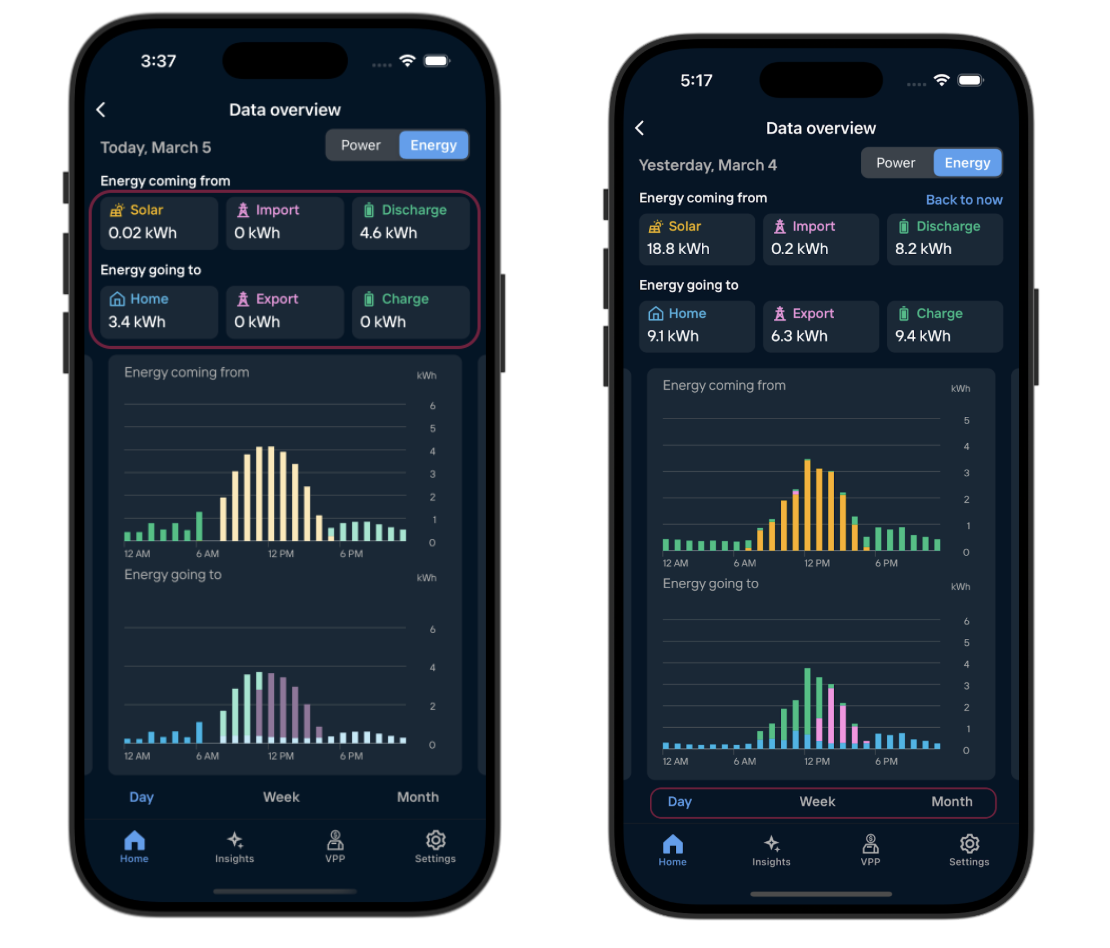
In the Energy view, the component tiles display totals for your selected timeframe. To see a specific hour or day, tap the corresponding bar in the chart, and the tiles will then update to show the totals for that selected period.